Risk Traceability Matrix
In my CSSLP training a few months ago, a topic came up about a risk traceability matrix. Something I remembered, is that I was used to use something like this as a test consultant for risk based testing.
Before I could start with risk based testing I had to know which risks were identified, which impact it could have on the business and the probability the risk would occur. This was often preceded by so-called product risk analyzes. In such a session we sat with a number of colleagues (in different roles) to identify and classify risks.
The biggest challenge was to agree on the classification of a risk. For this I had made an Excel sheet in which a value could be linked to the impact and probability. Each role had to fill in those fields in order to create a quantitative risk analyse.
After the CSSLP training I searched my archive for the file. It took me a while to find the right file. But the file in the state as is, it was not something I would like to share yet. For example the file was in Dutch and I had to debug some VBA code before I could share it.
I know all too well that VBA code can be dangerous if run just like that. That is why I first describe the functionality in this article. The VBA code ensures that the average-valued risks are placed in the correct prioritized order. This is done by clicking the “Prioritize risks” button. Obviously, I recommend looking at the source code before running anything from the internet. Viewing the source code can be done in MS Excel with the ALT + F11 key combination.
Download
I’ve posted the file on Github so anyone can download and use the file. The source code within the Excel file can be viewed via Excel.
By downloading and using the file, you agree that changes and improvements to this file will be shared with the original file, so that this file also evolves and other users can take advantage of these additions.
Usage
Tab - Information
When opening the file, the “Information” tab will open. A project or application name can be entered at the top. On the left, names can be entered next to the roles. These are copied to the Risks tab so that they can enter a score per risk that is linked to their name. 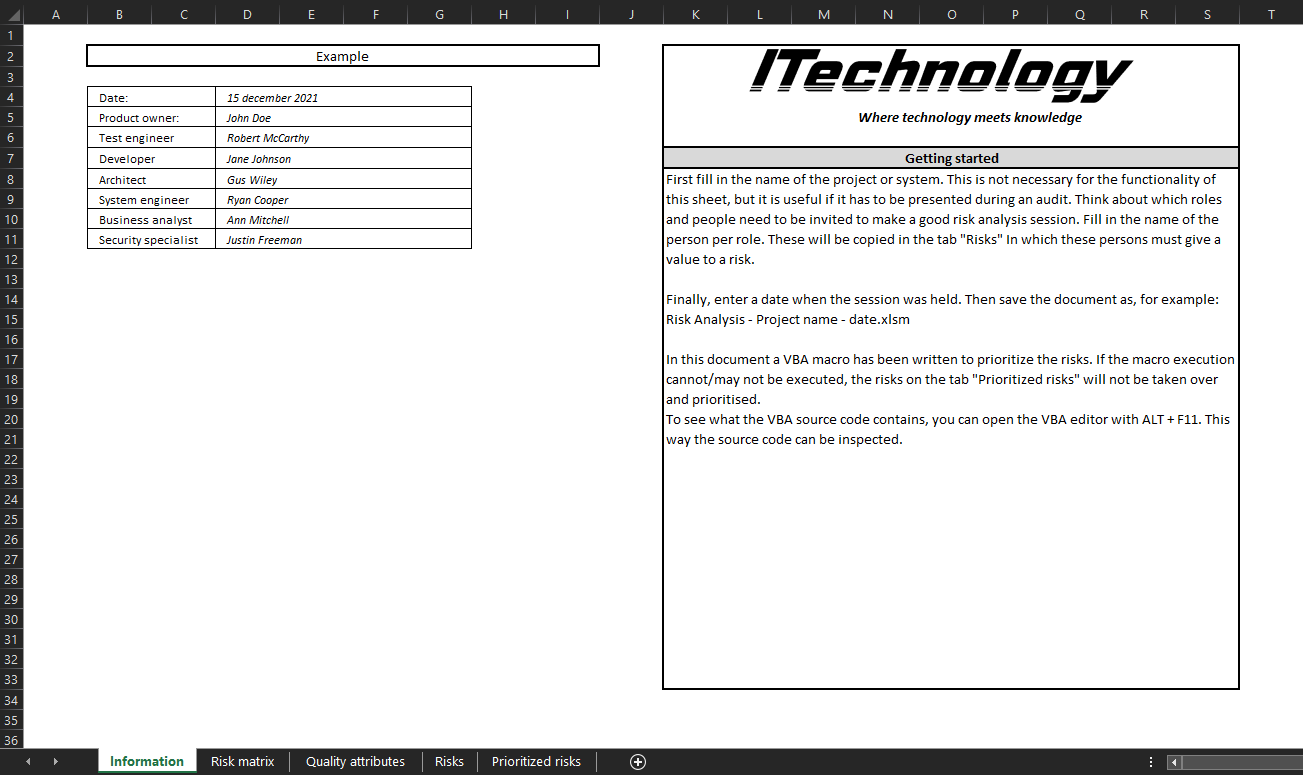
Tab - Risk matrix
The “Risk matrix” tab indicates how risks can be classified based on impact and likelihood. Examples are given of impact in terms of costs or how often and quickly something can occur, for example. These may differ per organization. So feel free to adjust them to the values within your own organization. The matrix has been drawn up so that risks can be prioritized. Keep this tab in mind when running a risk analysis session so that you can use it as a resource. 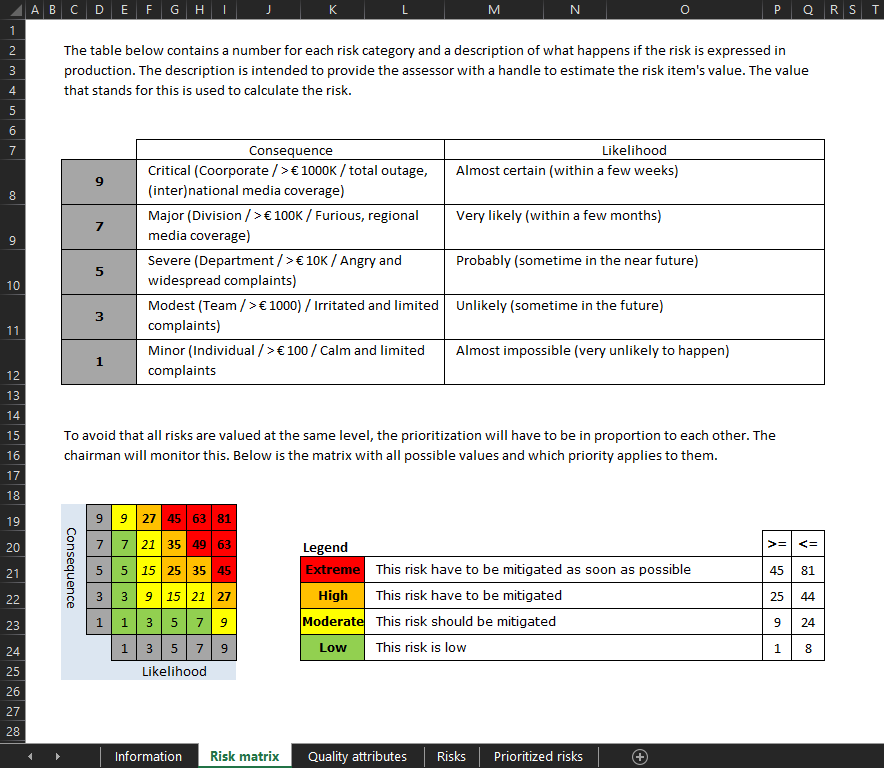
Tab - Quality attributes
I have added the tab “Quality attributes” based on TMap® (Test Management Approach) in this document, because quality attributes can be tested with this method and test techniques. In this way, a certain risk or user story can be tested in a structured way in a project. This is beneficial to guarantee the quality of a system. This tab is for informational purposes only, so you can select a proper test technique. 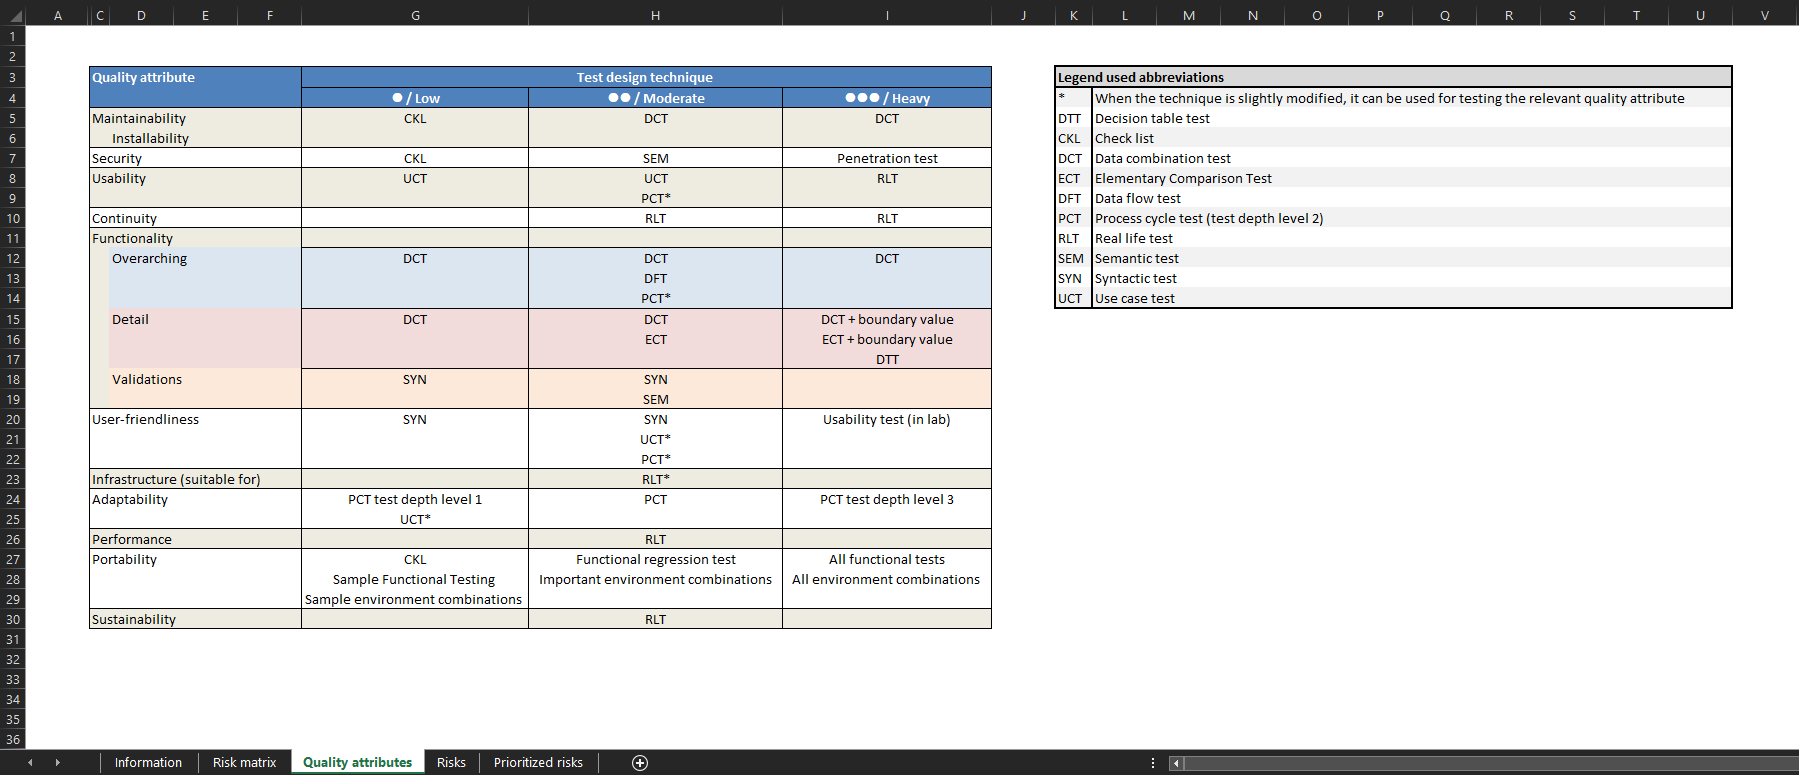
Tab - Risks
In the “Risks” tab, risks can be entered with the associated cause and a possible consequence. Each participant can then enter a value for the impact and likelihood per risk. Based on this data, an average value is obtained for the risk classification. In this tab you can indicate which user story and which quality attribute can be associated with a risk. 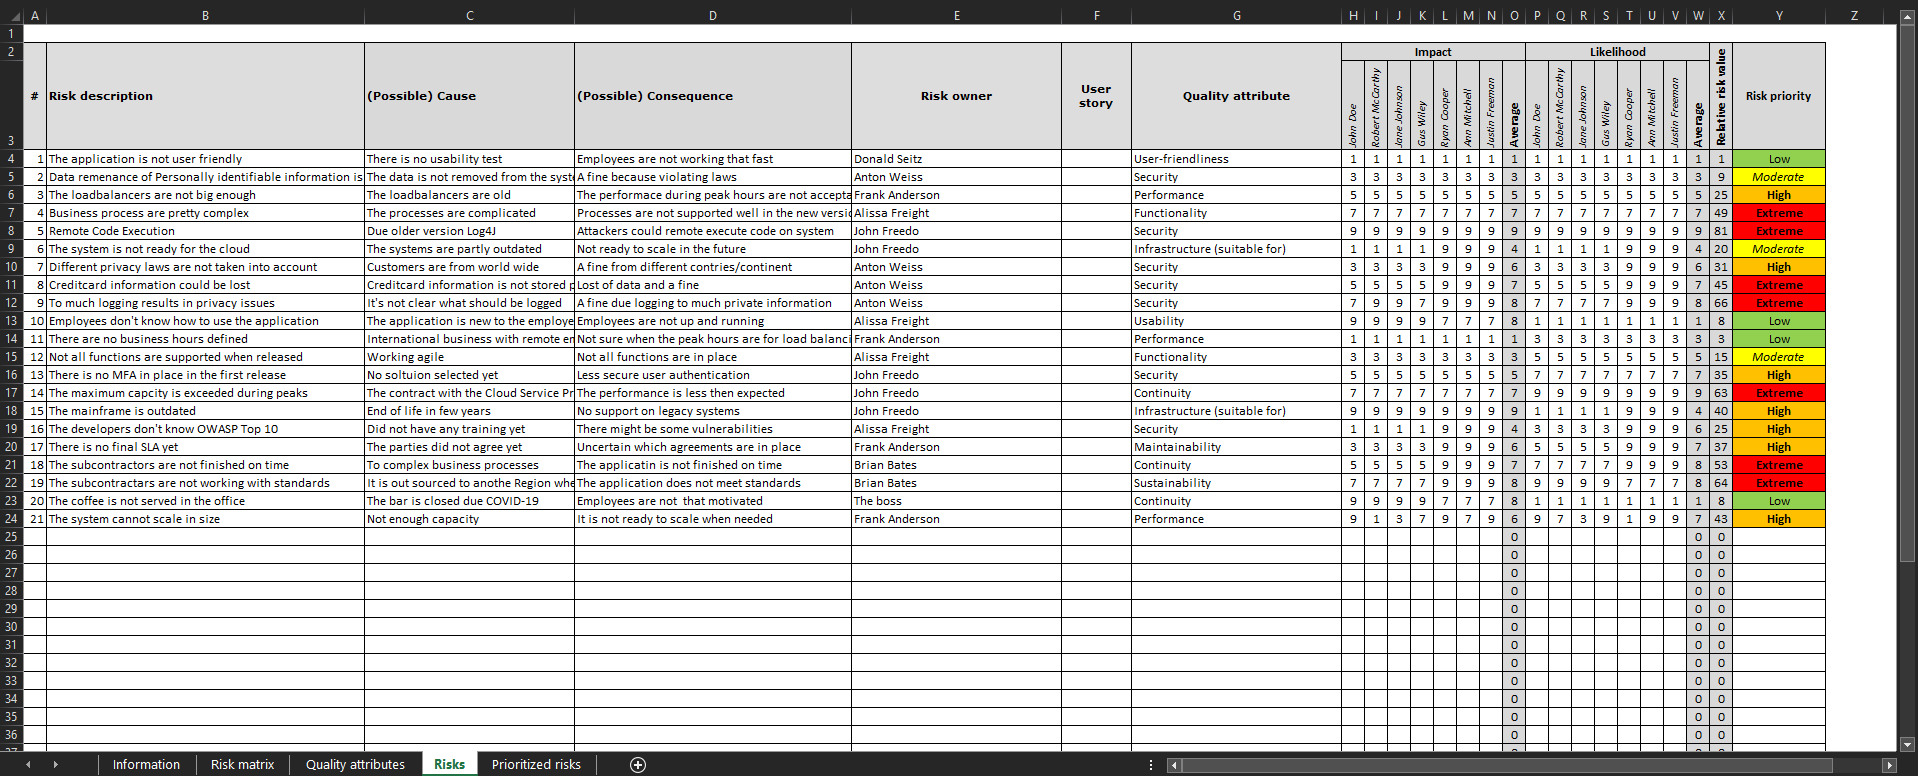
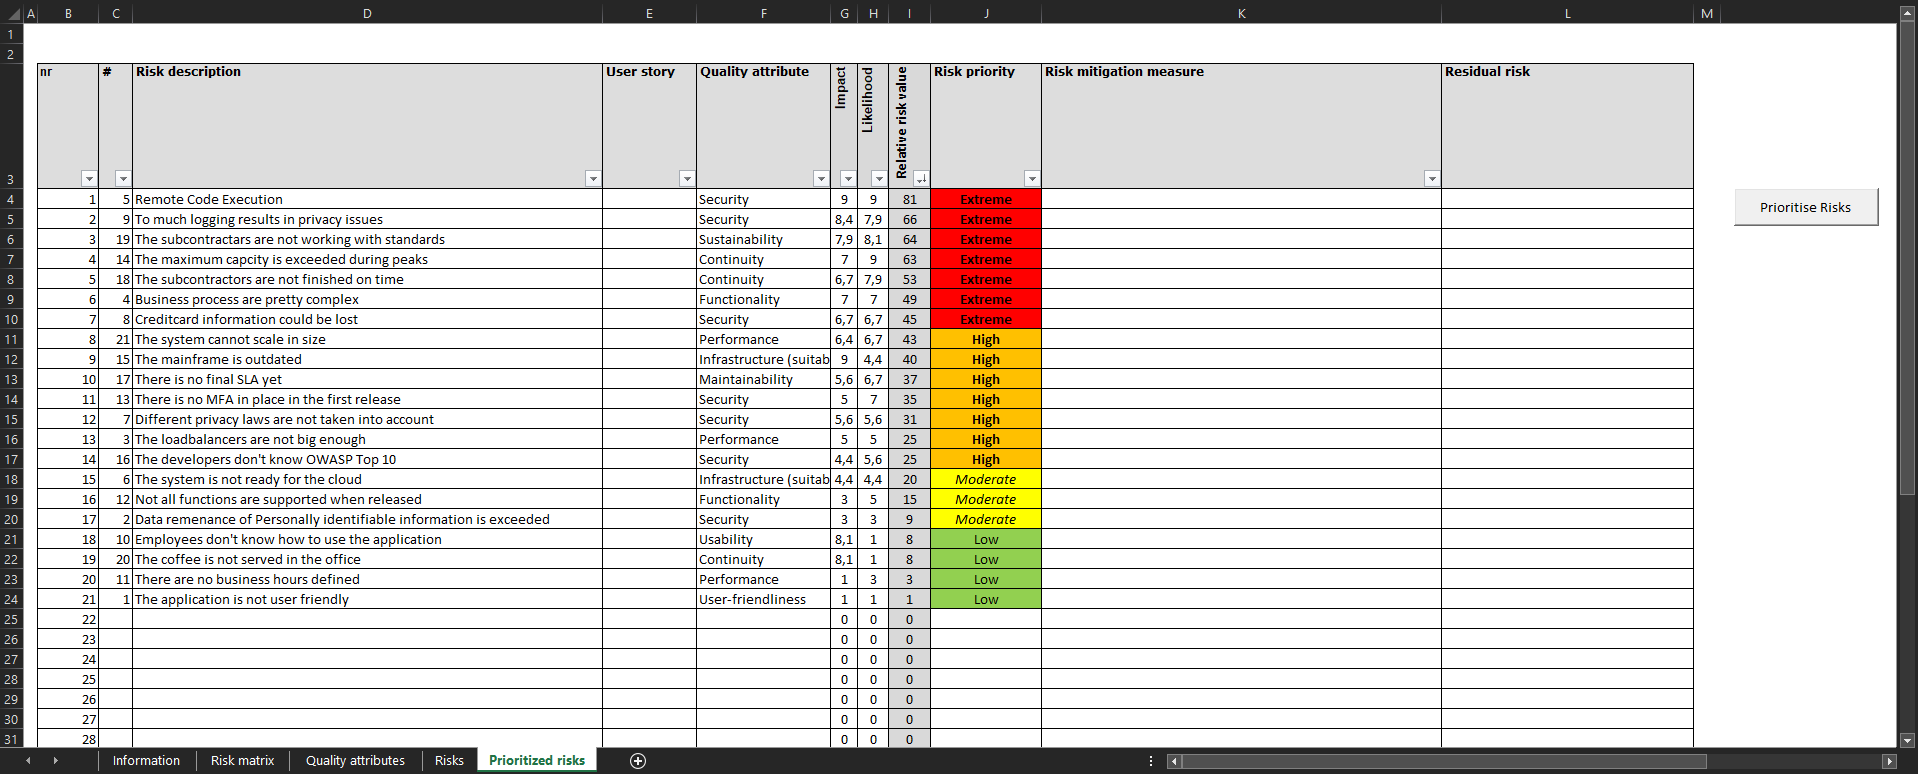
Tab - Prioritized risks
The last tab “Prioritized risks” will initially be empty. On the right side of the tab is the “Prioritize risks” button. When clicked on this, the VBA code will place the risks in the correct order on this tab. A mitigating measure can also be included here and a residual risk can be indicated. 